

Visual Design
It all starts with data and knowing how to translate it with an understanding of how the user will use it or interact with it. Each data visualization project, whether a map, chart or diagram, has a purpose that needs to be communicated to a specific consumer. With that in mind, I begin to create the visualizations and design patterns to present the data clearly and to help the user flow through the data as effortlessly as possible. Even though the data may be complex or appear dry in its raw form, it can become highly visual and fun, which only enhances the users experience.
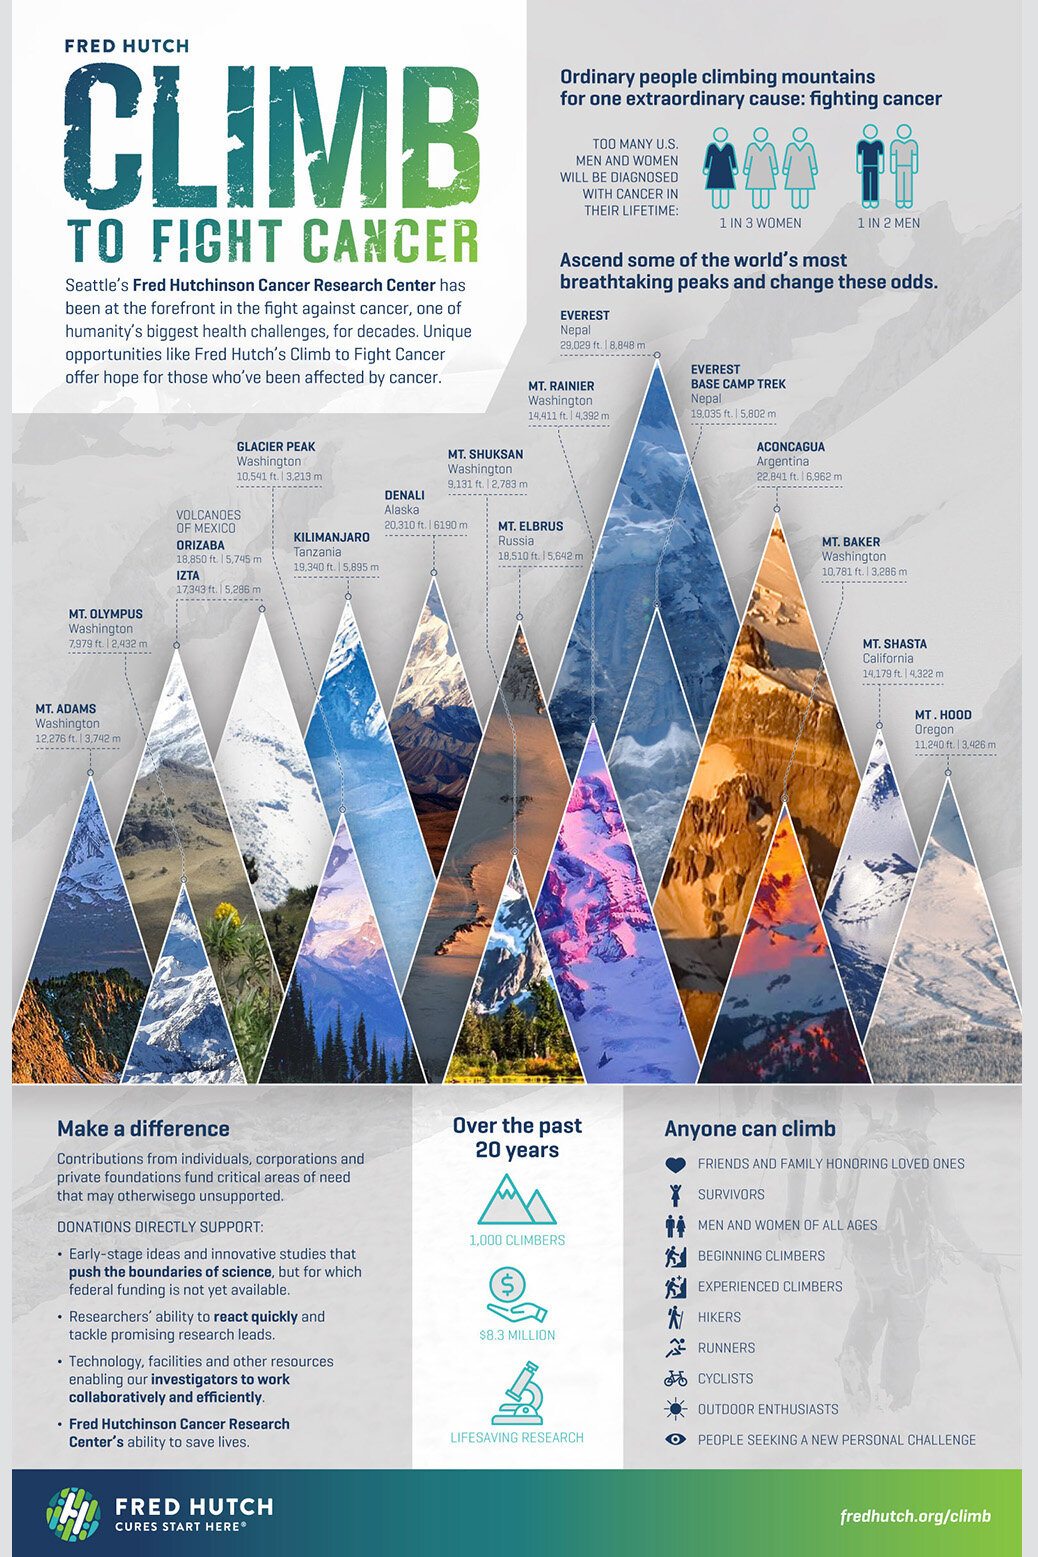
Climb to Fight Cancer: Promotional Poster
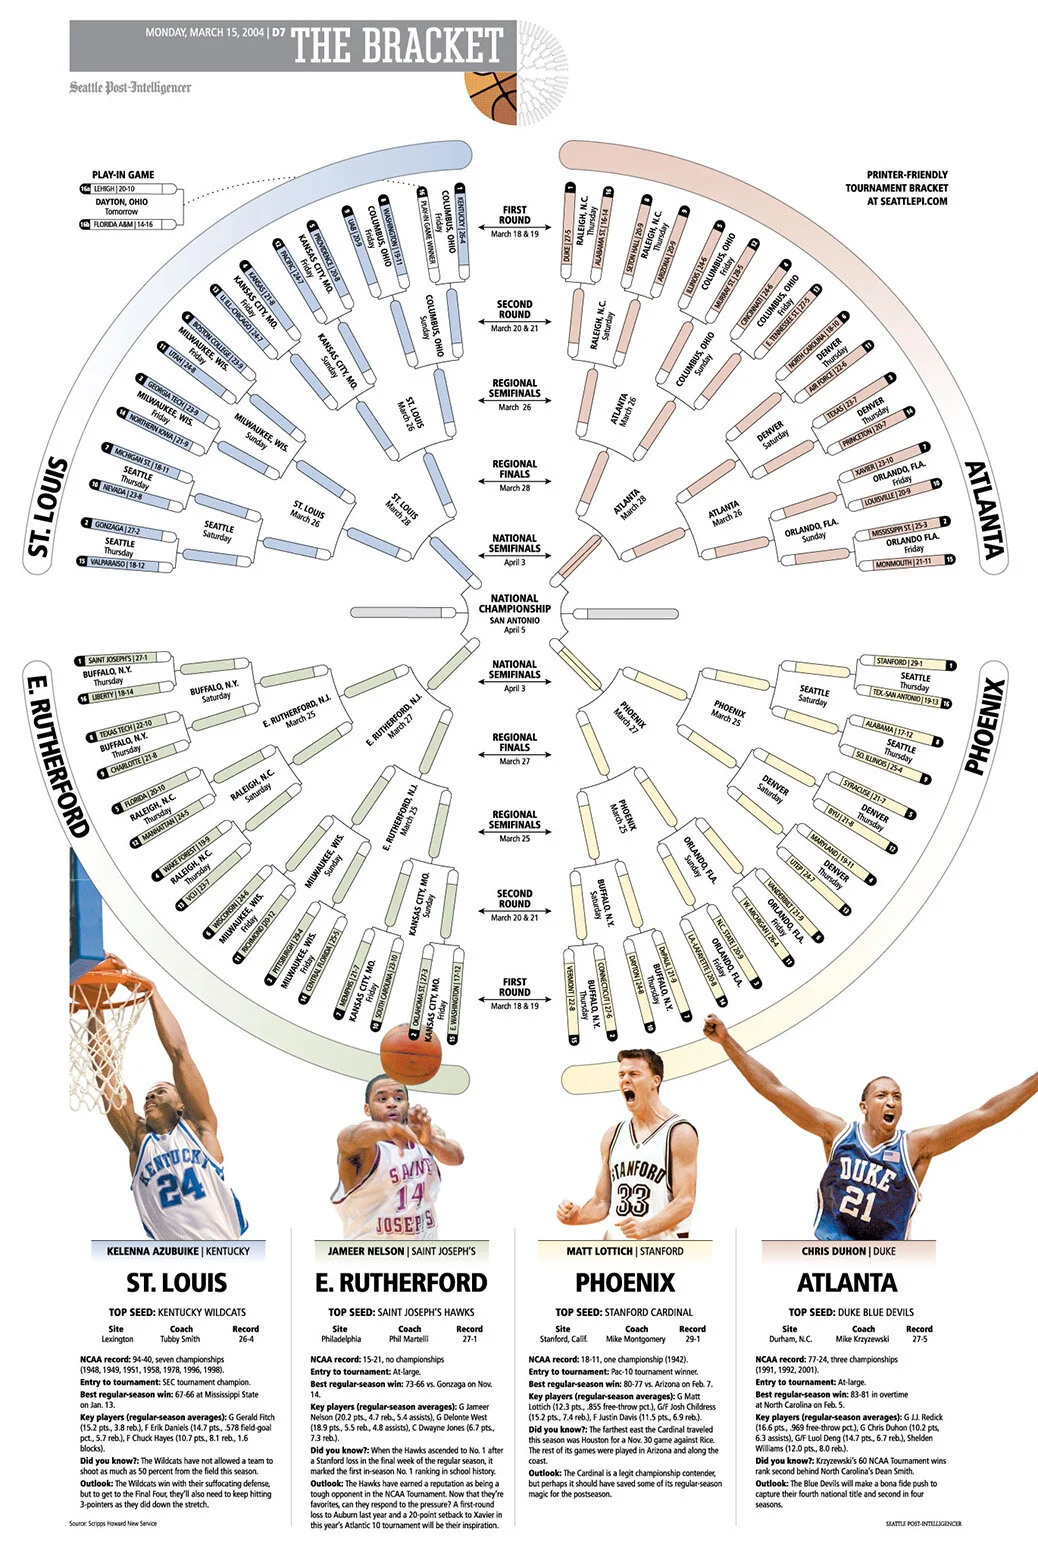
Seattle Post-Intelligencer: NCAA Men's Basketball Tournament Bracket

Allen Institute: The Dividing Cell: Educational Poster

Allen Institute: The Building Blocks of Your Brain: Educational Poster

Hutch Magazine: Bone Marrow Transplants Ins and Outs

Hutch Magazine: The Human Microbiome

Hutch Magazine: Targeting Cancer